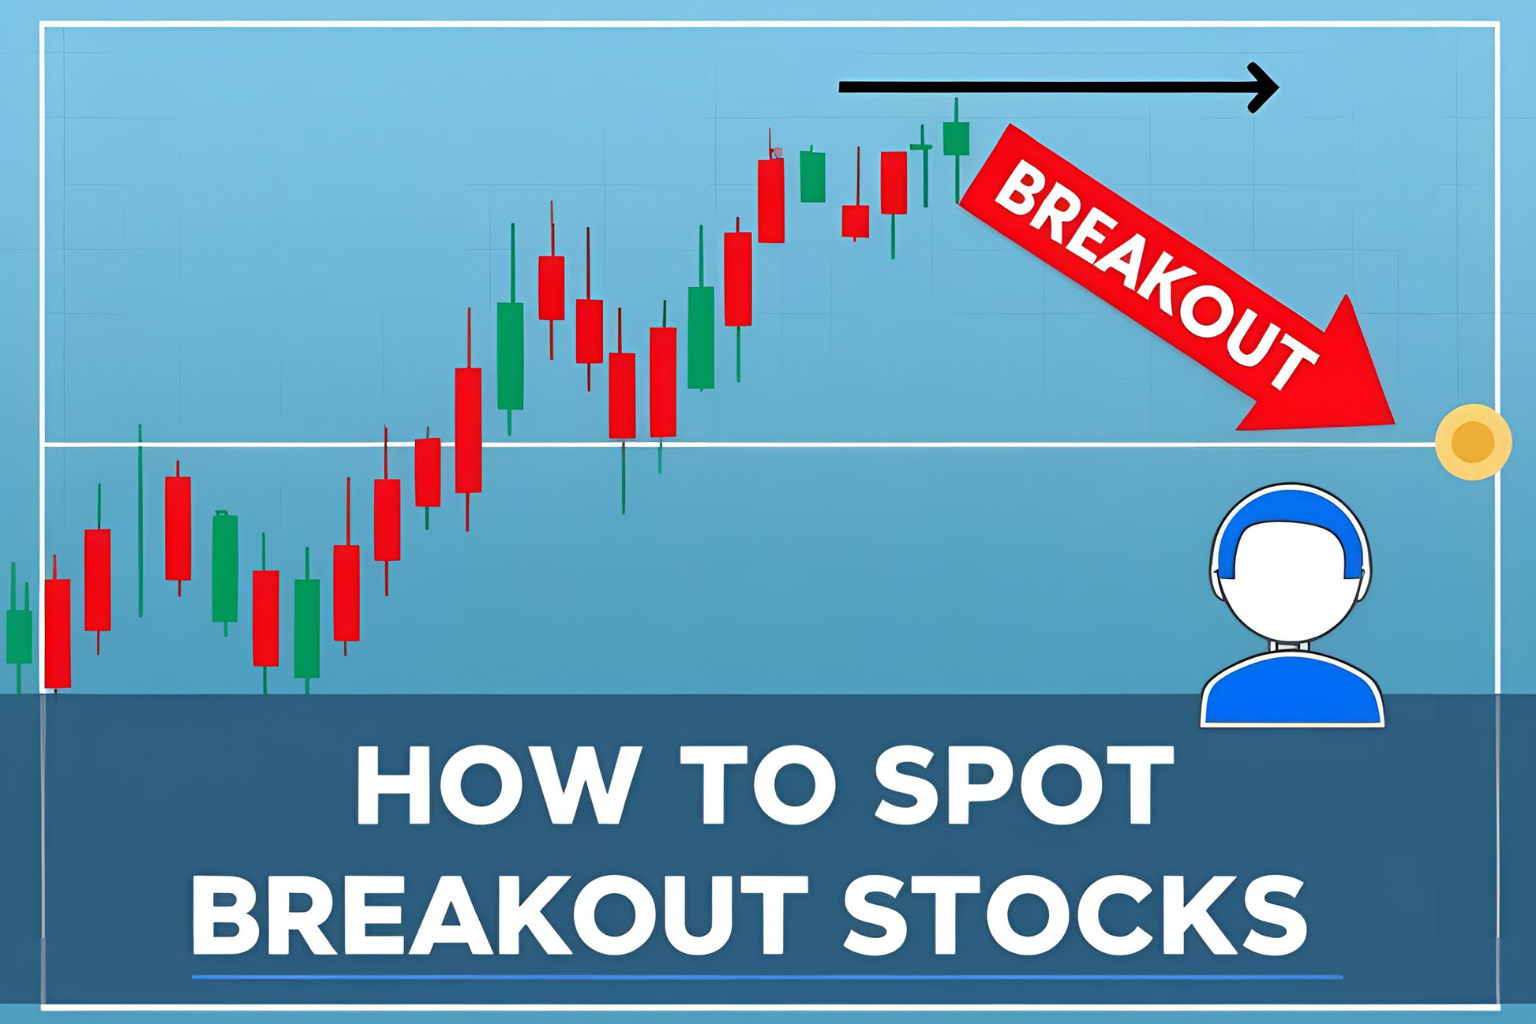
How to Spot Breakout Stocks: A Beginner’s Guide
One of the most powerful and popular trading strategies is the breakout trade—buying a stock when it moves above a key resistance level on strong momentum. Spotting breakout stocks can help beginner traders catch big moves early and ride the trend. In this guide, you’ll learn how to identify breakout setups, what signals to look for, and how to manage risk effectively.
What Is a Breakout in Trading?
A breakout occurs when the price moves above resistance (or below support for shorts) with increased volume and momentum. It signals that buyers are gaining control and a new trend may be starting.
Common breakout areas:
- Horizontal resistance (previous highs)
- Chart patterns (triangles, flags, rectangles)
- Round-number levels (e.g., $50, $100)
1. Identify Consolidation or Base Patterns
Before a breakout, many stocks form tight ranges or base patterns.
What to look for:
- Sideways movement after a prior uptrend
- Decreasing volume during consolidation
- Multiple touches of resistance without breaking through
Common patterns:
- Ascending triangle
- Flat-top base
- Cup and handle
2. Watch for Volume Spikes on Breakout
Volume confirms whether a breakout is real or likely to fail. A strong breakout typically occurs on above-average volume.
Breakout volume checklist:
- Volume is at least 50% higher than average
- Occurs with a wide-range green candle
- Accompanied by bullish momentum (RSI, MACD crossover)
3. Use Alerts and Screeners to Find Breakout Candidates
You don’t have to manually scan every chart. Use stock screeners to filter for breakout conditions.
Tools to try:
- TradingView Screener: Filter by price breakout and volume surge
- Finviz: Use “Current Price above SMA50” and “High Relative Volume”
- Yahoo Finance Alerts: Set breakout levels on watchlist stocks
4. Plan Entry, Stop, and Target
A well-structured trade plan increases your success rate.
Example Trade Plan:
- Entry: On candle close above resistance
- Stop-Loss: Just below breakout level or last swing low
- Target: Measure height of base and project upward (measured move)
5. Avoid False Breakouts with Confirmation
Not all breakouts lead to trends. Some fail and reverse quickly (a “fakeout”).
Tips to reduce risk:
- Wait for a close above resistance, not just a wick
- Confirm with indicators like RSI > 50 or MACD crossover
- Don’t chase breakouts that are extended far from base
FAQs
What is a breakout stock?
A stock that moves above a defined resistance level on strong volume, often starting a new trend.
What’s the best timeframe to spot breakouts?
Daily or 4-hour charts are ideal for beginners. They reduce noise and give cleaner setups.
How do I confirm a breakout is real?
Look for strong volume, candle close above resistance, and momentum indicator support.
Can I use breakouts for swing trading?
Yes, breakout trading is one of the most reliable swing trading strategies.
Should I buy right after a breakout?
Wait for confirmation—a strong close and volume spike help avoid false breakouts.