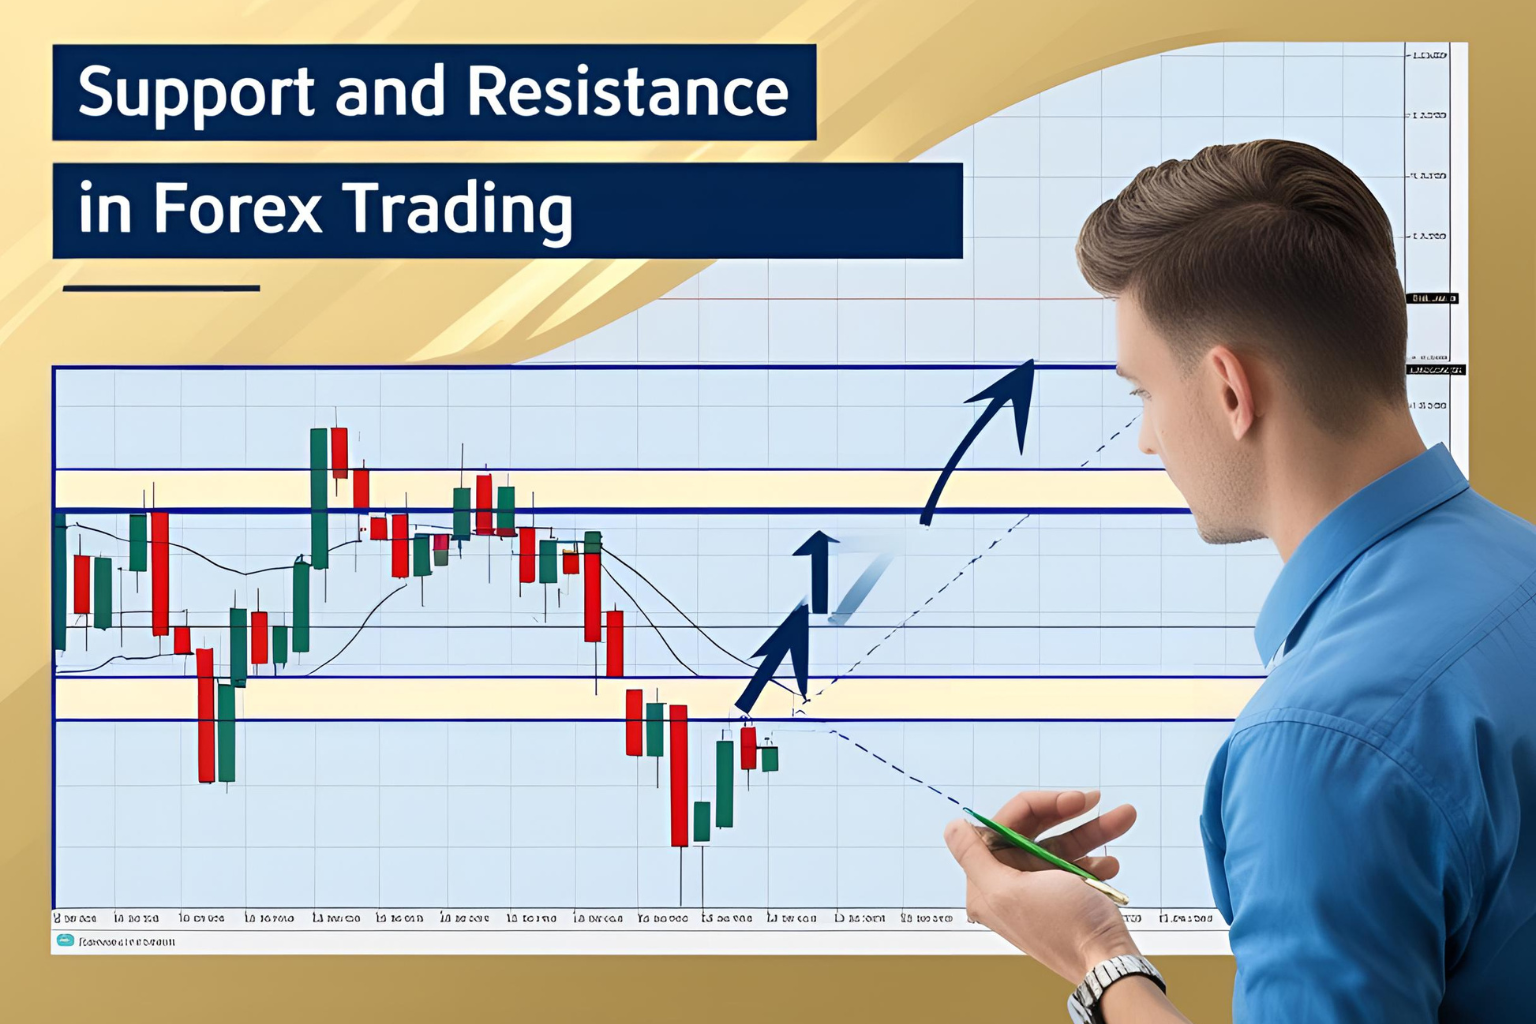
How to Trade Forex with Support and Resistance
Support and resistance are two of the most important concepts in forex trading. They form the foundation of most price action strategies and help traders make logical decisions about entries, exits, and risk control. This beginner’s guide will show you how to identify these zones and use them to generate simple, effective forex trade ideas.
What Are Support and Resistance?
- Support: A price level where buyers tend to step in, stopping the price from falling further.
- Resistance: A price level where sellers tend to appear, preventing the price from rising.
These zones act like floors (support) and ceilings (resistance) on a price chart.
1. How to Identify Support and Resistance Levels
Look for price areas where:
- The market reversed direction multiple times
- Strong candlestick patterns (like pin bars or engulfing candles) formed
- Volume increased significantly
Tools to use:
- Horizontal line tool (on platforms like TradingView or MetaTrader)
- Round numbers (e.g., 1.1000 on EUR/USD) often act as psychological barriers
2. Entry Strategy: Buy at Support, Sell at Resistance
This is a classic forex trading setup that works across timeframes.
Buy Setup:
- Price approaches support zone
- Wait for a bullish reversal candle (e.g., hammer or bullish engulfing)
- Entry: On confirmation candle close
- Stop-Loss: Just below support
- Target: Next resistance zone
Sell Setup:
- Price nears resistance
- Wait for bearish rejection
- Stop-Loss: Just above resistance
- Target: Previous support or trendline
3. Trade Breakouts of Support or Resistance
Sometimes, price breaks through a level decisively, signaling a shift in momentum.
Strategy:
- Entry: On candle close outside the level with strong volume
- Stop-Loss: Inside the broken zone
- Target: Equal to the height of the previous range
Tip: Wait for a retest of the broken level for safer entries.
4. Use Support and Resistance with Indicators
Enhance your confidence with tools like:
- RSI: Confirm overbought/oversold zones
- Moving Averages: Confirm trend direction
- Volume indicators: Spot strength behind the move
Example: If price hits support and RSI is below 30, it increases the chance of a bounce.
FAQs
Do support and resistance levels work on all timeframes?
Yes. The higher the timeframe (e.g., daily), the stronger the level. However, intraday traders can also use 15m or 1H charts.
How many times should a level be tested?
Two or more touches increase the reliability of the level.
What’s the best forex pair to trade with support/resistance?
EUR/USD, GBP/USD, and USD/JPY are great due to their liquidity and respect for technical levels.
How can I avoid false breakouts?
Wait for candle close beyond the level and confirmation from volume or momentum indicators.
Is support/resistance better than indicators?
They’re best when used together. Support/resistance gives structure; indicators confirm the setup.